Set system time via ntpdate // get rid of daemons!

I don’t like to have daemons listening on the systems I am responsible for. This is the reason why I check periodically all systems with netstat -tulpen to see what processes are actually listening, look if they are needed and may be bound to localhost only.

I used to set the system time via ntpd, but many years ago I switched to a simple cron job that runs ntpdate. This is good enough for all systems that don’t depend on milliseconds and smooth time shift etc. I was able to remove ntpd from almost all servers. My cron job looks like this:

## ntpdate Cron Job
 
# Environment Settings
MAILTO=root
PATH=/usr/local/sbin:/usr/local/bin:/sbin:/bin:/usr/sbin:/usr/bin
 
# Job Definition
*/30 * * * *  root  /usr/sbin/ntpdate 0.pool.ntp.org > /tmp/ntpdate.prt 2>&1

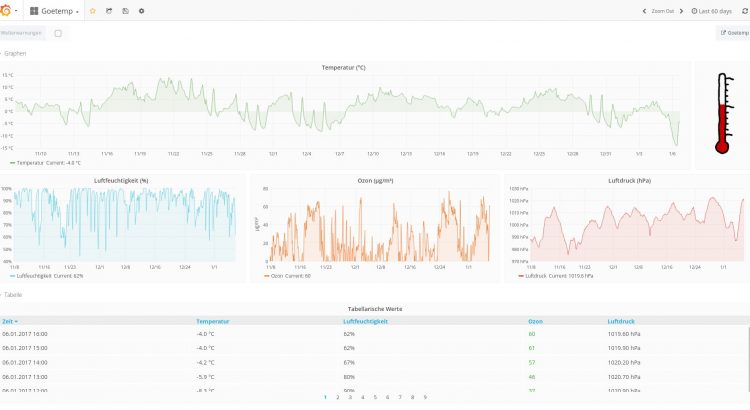
Ein Grafana Dashboard für Goetemp

Über mein kleines Projekt Goetemp habe ich hier schon öfter geschrieben. Seit nunmehr über sieben Jahren sammle ich Wetterdaten aus Göttingen und spiele damit herum.

In den vergangenen Tagen habe ich das Backend für die Simple JSON Datasource für Grafana implementiert. Damit ist es nun möglich die Daten auch in Grafana zu visualisieren. Zuerst hatte ich überlegt die Daten auch gleich in eine InfluxDB zu schreiben, aber die Implementierung des Backends für die Datasource war erheblich schneller realisiert.

Mehr dazu habe ich auf der Goetemp Webseite geschrieben. Hier kann auch das Dashboard heruntergeladen werden. Zum spielen mit dem Datenbestand habe ich einen Snapshot freigegeben:

MySQL – Show open connections and processes

Einmal an die eigene Notizwand gekritzelt:

  1. MySQL Verbindungen + weitere Verbindungsrelevante Infos anzeigen:
    root@localhost [(none)]> show status like '%onn%';
    +--------------------------+--------+
    | Variable_name            | Value  |
    +--------------------------+--------+
    | Aborted_connects         | 0      |
    | Connections              | 440921 |
    | Max_used_connections     | 67     |
    | Ssl_client_connects      | 0      |
    | Ssl_connect_renegotiates | 0      |
    | Ssl_finished_connects    | 0      |
    | Threads_connected        | 2      |
    +--------------------------+--------+
    7 rows in set (0.00 sec)
  2. MySQL Prozessliste anzeigen:
    root@localhost [(none)]> show processlist;
    +--------+-------+-----------+-------+---------+------+-------+------------------+
    | Id     | User  | Host      | db    | Command | Time | State | Info             |
    +--------+-------+-----------+-------+---------+------+-------+------------------+
    | 440912 | ttrss | localhost | ttrss | Sleep   |    0 |       | NULL             |
    | 440919 | root  | localhost | NULL  | Query   |    0 | NULL  | show processlist |
    +--------+-------+-----------+-------+---------+------+-------+------------------+
    2 rows in set (0.00 sec)
  3. Der status Parameter der mysqladmin Binary auf der Kommandozeile:
    root@host ~ $ mysqladmin status
    Uptime: 1621495  Threads: 2  Questions: 18982236  Slow queries: 6  Opens: 83474  Flush tables: 1  Open tables: 400  Queries per second avg: 11.706
    
  4. Und last but not least auch noch einmal die Prompt-Einstellung aus der /etc/mysql/my.cnf festgehalten:
    [mysql]
    prompt = \u@\h [\d]>\_

Die MySQL Befehle habe ich von dieser Webseite kopiert. Die Prompt Einstellungen weiß ich nicht mehr woher…